Blog 1: Deforestation
I learned that from 2000 to 2005 close to one percent of the worlds rain forests were cut down. The number one reason deforestation occurs is to clear land for agriculture. Large areas of forests are cut down and burned. It has contributed to greenhouse gas emissions, global warming, and extinction.
The best part of this blog would have to be that it was so informational and easy to understand.
Adding more information on how deforestation contributed to greenhouse gas emissions, global warming, and extinction would improve this blog.
Blog 2: Local Weather History
I learned that local and long term weather is a way for scientist to figure out future and past weather to see how it will affect out earth. Scientists study the earth’s atmosphere characteristics, motions, and processes to figure the future weather. Including the earth’s air pressure, temperature, humidity, wind velocity and apply physics and mathematics. Weather affects our earth in many ways. From global warming, to the increase in water levels and destroying land. Excessive weather change is the cause of these problems.
The best part of the blog was the information it gave. It explained things about weather that I never really thought about.
This blog would improve if the grammar was better.
Blog 3: Thunderstorms
I learned most thunder storms occur in the spring time when the air is warm. Thunderstorms are increasing due to global warming. A thunderstorm is created when warm air rises and condenses into a cumulus cloud. As more warm air rises the cumulus cloud grows larger and heaver.
The best part of the blog is the information on how thunderstorms affect human lives.
This blog would greatly improve if it was edited to correct the grammatical errors.
Wednesday, February 11, 2009
Sunday, February 8, 2009
Ice Age.
2. The ice age is a time of irregular climate, that was worse in B.C. Researchers can measure ancient temperatures by oxygen isotopes in icebergs that have been around for thousands of years. Large glaciers in Greenland and Antarctica were a big help in discovering temperatures dating back hundreds of years. Periods of time that have irregular temperatures but aren’t considered actual ice ages are called little ice ages, which are basically periods of cooling after warm eras. Several ice ages have occured throughout history.
picture link - http://www.crrel.usace.army.mil/permafrosttunnel/Ice_Age_Cycles.jpg
4. Two causes of the little ice ages are decreased solar activity and increased volcanic activities around the world. Many researchers have different opinions on the typical weather patterns so ice ages are hard to identify. Ice ages are basically unusual periods of global and regional changes. There’s debates in contributors to ice ages like solar, volcanic, and oceanic occurrences. The last recorded ice age was nearly 12000 years ago. Thousands of years ago weather wasn’t as predictable.
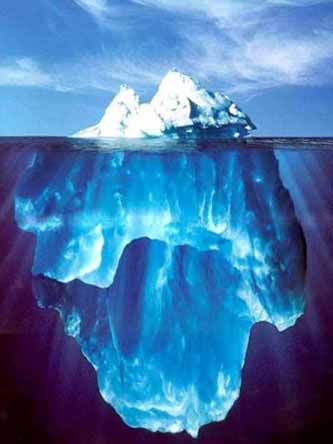
picture link - http://www.crystalinks.com/icebergblue.jpg
2. When ice bergs melt, they leave behind sediments that may be frozen thousands of years before. There’s recurring cooling events every 1500 years or so. Oceans that contain ice bergs that are melting indicate temperatures with a series of 1-2 degrees Celsius. The same sediments were found near Africa, indicating times of irregular temperatures. The sediments from Africa were ranging from 3-8 degrees Celsius.
picture link - http://web.ncf.ca/jim/ref/twoMileTimeMachine/iceAges.png
1. The depth of the Antarctic glaciers makes them more useful when it comes to researching because it shows more. Times of high volcanic activity can be shown too because of sediments from ash can cloud solar radiation for up to 2 years. Cooling temperatures and low sun activity over time correlates with volcanic activities.
picture link - http://lh5.ggpht.com/_dIgAPkniWsM/R6X_le1iHrI/AAAAAAAAFbw/RjNNM_ICCDw/IMG_0609+edited.jpg
3. Depending on the researcher, little ice ages were recorded an average of three times between the 16th and 19th century. Little ice ages were introduced to scientific literature by Francois E. Matthes in 1939. Climatologists and historians can’t agree on exact dates of the events. Most researchers opinions are dependent on the local conditions.
picture link - http://aycu23.webshots.com/image/37902/2000927070208373189_rs.jpg
Ice ages are correlations of different regional and worldwide activities. Research is to show dates of the ice ages, where they occurred worldwide, temperatures, and why they happened. Ice ages leave behind sediments that are used to research that. The average of little ice ages are typically every 1500 years.
picture link - http://www.isgs.uiuc.edu/maps-data-pub/publications/geonotes/graphics/gn3--Glacier-Small.gif
http://www.answersingenesis.org/Home/Area/AnswersBook/images/16IceAge.jpg
http://earth.usc.edu/~stott/public_html/PNG%20figures/high-low%20latitude%20coupling.gif
http://www.johnstonsarchive.net/other/earthiceage.jpg
http://geoinfo.amu.edu.pl/wpk/pe/a/harbbook/c_viii/images/alpine/Bee0054.GIF
bibliography.
1. URL - www.dmns.org/main/en/minisities/iceage/ia_indepth/index.html
title - ICE AGE.
author - n/a.
organization - Denver Museum of Nature and Science.
copyright/date created - 2005.
2. URL - www.muller.lbj.gov/pages/iceagebook/history_of_climate.html.
title - History of Climate.
author - William Buckland.
organization - n/a.
copyright/date created - n/a.
3. URL - www.en.wikipedia.org/wiki/little_ice_age#causes.com
title - Little Ice Age.
author - wikipedia.
organization - wikipedia.
copyright/date created - last update - january, 2009.
4. URL - www.geocraft.com/wvfossils/ice_ages.html
title - Global Warming - A Chilling Perspective.
author - Monte Hieb.
organization - Denver Museum of Nature and Science.
copyright/date created - October 5th, 2007.
picture link - http://www.crrel.usace.army.mil/permafrosttunnel/Ice_Age_Cycles.jpg
4. Two causes of the little ice ages are decreased solar activity and increased volcanic activities around the world. Many researchers have different opinions on the typical weather patterns so ice ages are hard to identify. Ice ages are basically unusual periods of global and regional changes. There’s debates in contributors to ice ages like solar, volcanic, and oceanic occurrences. The last recorded ice age was nearly 12000 years ago. Thousands of years ago weather wasn’t as predictable.
picture link - http://www.crystalinks.com/icebergblue.jpg
2. When ice bergs melt, they leave behind sediments that may be frozen thousands of years before. There’s recurring cooling events every 1500 years or so. Oceans that contain ice bergs that are melting indicate temperatures with a series of 1-2 degrees Celsius. The same sediments were found near Africa, indicating times of irregular temperatures. The sediments from Africa were ranging from 3-8 degrees Celsius.
picture link - http://web.ncf.ca/jim/ref/twoMileTimeMachine/iceAges.png
1. The depth of the Antarctic glaciers makes them more useful when it comes to researching because it shows more. Times of high volcanic activity can be shown too because of sediments from ash can cloud solar radiation for up to 2 years. Cooling temperatures and low sun activity over time correlates with volcanic activities.
picture link - http://lh5.ggpht.com/_dIgAPkniWsM/R6X_le1iHrI/AAAAAAAAFbw/RjNNM_ICCDw/IMG_0609+edited.jpg
3. Depending on the researcher, little ice ages were recorded an average of three times between the 16th and 19th century. Little ice ages were introduced to scientific literature by Francois E. Matthes in 1939. Climatologists and historians can’t agree on exact dates of the events. Most researchers opinions are dependent on the local conditions.
picture link - http://aycu23.webshots.com/image/37902/2000927070208373189_rs.jpg
Ice ages are correlations of different regional and worldwide activities. Research is to show dates of the ice ages, where they occurred worldwide, temperatures, and why they happened. Ice ages leave behind sediments that are used to research that. The average of little ice ages are typically every 1500 years.
picture link - http://www.isgs.uiuc.edu/maps-data-pub/publications/geonotes/graphics/gn3--Glacier-Small.gif
http://www.answersingenesis.org/Home/Area/AnswersBook/images/16IceAge.jpg
http://earth.usc.edu/~stott/public_html/PNG%20figures/high-low%20latitude%20coupling.gif
http://www.johnstonsarchive.net/other/earthiceage.jpg
http://geoinfo.amu.edu.pl/wpk/pe/a/harbbook/c_viii/images/alpine/Bee0054.GIF
bibliography.
1. URL - www.dmns.org/main/en/minisities/iceage/ia_indepth/index.html
title - ICE AGE.
author - n/a.
organization - Denver Museum of Nature and Science.
copyright/date created - 2005.
2. URL - www.muller.lbj.gov/pages/iceagebook/history_of_climate.html.
title - History of Climate.
author - William Buckland.
organization - n/a.
copyright/date created - n/a.
3. URL - www.en.wikipedia.org/wiki/little_ice_age#causes.com
title - Little Ice Age.
author - wikipedia.
organization - wikipedia.
copyright/date created - last update - january, 2009.
4. URL - www.geocraft.com/wvfossils/ice_ages.html
title - Global Warming - A Chilling Perspective.
author - Monte Hieb.
organization - Denver Museum of Nature and Science.
copyright/date created - October 5th, 2007.
Thursday, February 5, 2009
Climate change video
Previous to watching the video I knew that we have a lot in store for our future. For the past years we have been releasing co2 into our atmosphere and causing greenhouse gases. The combination of the two is creating global warming.
From the video I learned that there is an earth stimulator that will help predict the future of our planet. It predicts weather patterns and analyzes temperatures and wind. It has predicted for the future stronger hurricanes, and higher temperatures, which causes deadly heat waves. Also all ice caps are predicted to melt, increasing water levels that will flood all coastal regions.
From the video I learned that there is an earth stimulator that will help predict the future of our planet. It predicts weather patterns and analyzes temperatures and wind. It has predicted for the future stronger hurricanes, and higher temperatures, which causes deadly heat waves. Also all ice caps are predicted to melt, increasing water levels that will flood all coastal regions.
Seasonal light activity
Before this activity I knew that the sun was more intense in the winter than the summer...and thats about it. I learned that the sun is indeed more intense in the winter however, it covers less area. In the summer the sun is less intense but covers more area.
Monday, February 2, 2009
How radiation affects ice age
From the experiment I learned that sand absorbs more heat from the sun than both water and soil. Sand cools very slow, retaining the heat for a long time. Radiation pertains to my topic, Ice Age, because when sun`s radiation gets trapped in the atmosphere the earth doesn't heat, causing cooler temperatures. Carbon dioxide absorbs all infrared radiation available to it in about 10 meters, and water vapor in less than one meter. These substances shorten the distance that some of the radiation would travel. A shorter distance may cause global cooling.
Subscribe to:
Comments (Atom)